Sample question
What happens if I'm off-track to graduate at the end of sophomore year? Walk me through exactly who contacts me and what the support process looks like.
The College of Idaho is a private, nonprofit institution in Idaho. This report benchmarks The College of Idaho's most recent reported year (2024) against 2,000+ U.S. colleges across three dimensions: student outcomes, financial health, and value for money. All figures are drawn from federal IPEDS filings and are reported without editorial judgment.
Inspection flags are nine independent checks across student outcomes, financial health, and cost-to-value that surface areas of a college's reported numbers worth a closer look. A triggered flag means the college's data met a specific threshold that students and families may want to ask about — for example, graduation rates slipping below a level, or tuition rising while outcomes decline. A clear flag means the threshold was not met. Flags are signals for further conversation, not verdicts.
Every campus tour is a sales pitch. Colleges will show you the beautiful quad and the smiling Dean — not what doesn't flatter them. The right questions can reveal information that significantly impacts your experience.
Free early access to My College Decision Lens.
Bring better questions to The College of Idaho.
Releasing August 31, 2026. Request access now to be included at launch.
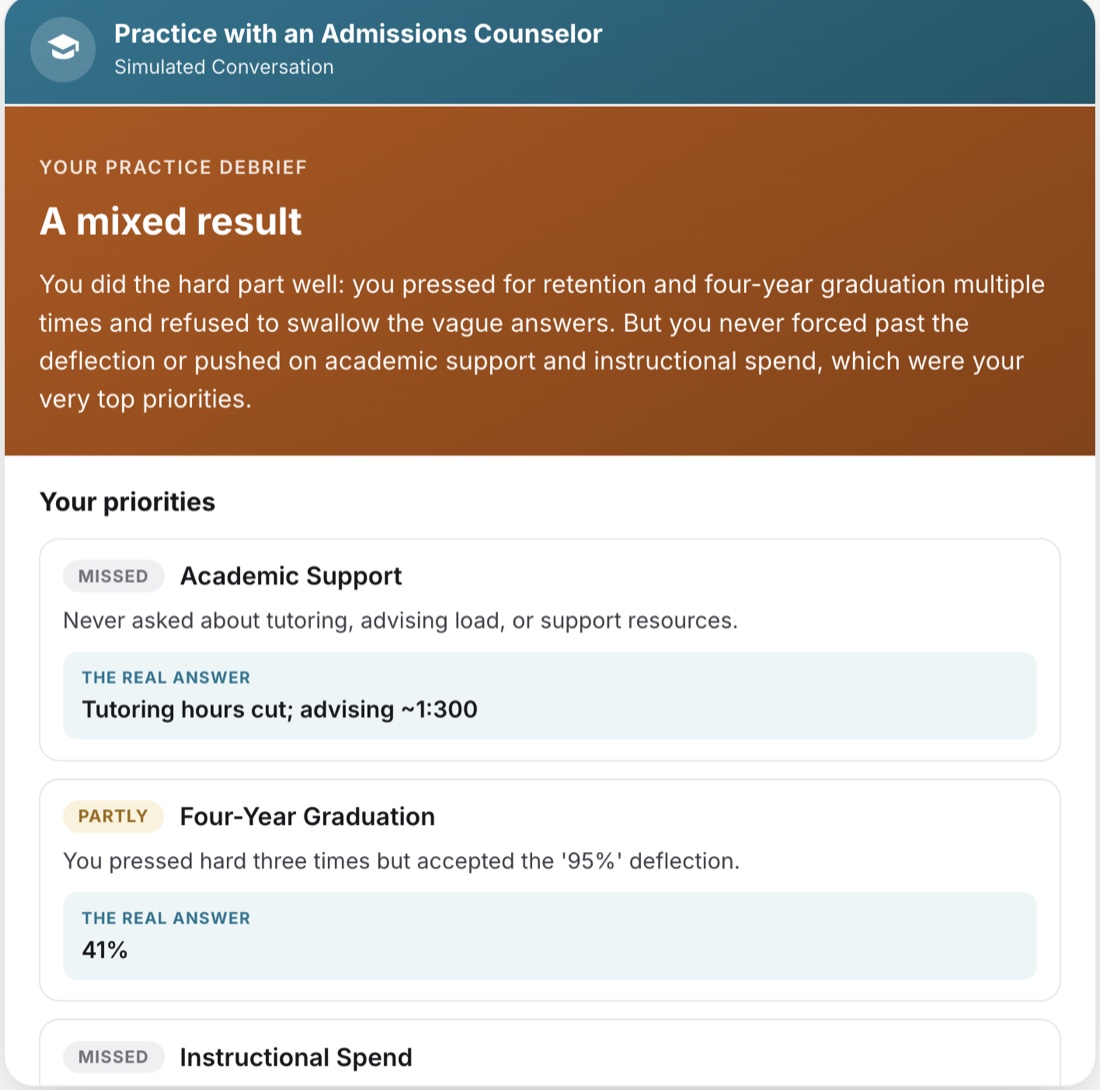
Rehearse with an admissions counselor, a financial aid representative, or a student tour guide — then get scored on how well you saw through the marketing.
What happens if I'm off-track to graduate at the end of sophomore year? Walk me through exactly who contacts me and what the support process looks like.
How much of my first-year package is renewable for all four years, and what specifically would cause it to change?
What is something about being a student here that you wish you had known before you enrolled?
For counselors: see what happens between meetings — which colleges are emerging, what concerns are unresolved, and where a student and family may be misaligned.
Releasing August 31, 2026.
How students at The College of Idaho complete their degrees, benchmarked against U.S. four-year colleges.
How financially stable The College of Idaho is, benchmarked against U.S. four-year colleges.
How The College of Idaho spends its budget and what families pay, benchmarked against U.S. four-year colleges.
Net price is the average annual out-of-pocket cost for first-time, full-time undergraduate students — tuition + fees + room & board, minus the grants and scholarships the institution reports providing to students in each income bracket. Select your household income below to see the reported figure for that group.
Plain-text reference table of every metric and inspection flag for The College of Idaho. Values reflect IPEDS-reported figures; percent changes reflect endpoint-to-endpoint 2020 → 2024 comparison; percentiles reflect 2024 national rank against four-year public and private nonprofit institutions. Cells marked "not reported" indicate the indicator was not present in IPEDS for this institution.
| Metric | 2024 Value | 5-Yr % Change | National Percentile |
|---|---|---|---|
| Four-Year Graduation Rate | 52.0% | -10.3% | 68th |
| Six-Year Graduation Rate | 60.0% | -14.3% | 58th |
| Full-Time Retention Rate | 82.0% | -2.4% | 66th |
| Pell Grant Six-Year Graduation Rate | 57.1% | -6.4% | 67th |
| Pell-to-Non-Pell Graduation Gap | 6.3pp | -25.4% | 40th |
| Pell Share of Cohort | 14.8% | -64.0% | 9th |
| Metric | 2024 Value | 5-Yr % Change | National Percentile |
|---|---|---|---|
| Revenue-to-Expense Ratio | 1.09× | +33.3% | 53rd |
| Total FTE Enrollment | 1,060 | -2.4% | 38th |
| Endowment Value | $125.6M | +24.7% | 69th |
| Net Assets (End of Year) | $178.5M | +10.4% | 65th |
| Metric | 2024 Value | 5-Yr % Change | National Percentile |
|---|---|---|---|
| Instructional Spending % | 28.3% | +4.0% | 30th |
| Student Support Spending % | 29.4% | +4.2% | 95th |
| Administrative Spending % | 17.1% | -16.9% | 45th |
| Instruction+Support to Admin Ratio | 3.37× | +25.4% | 65th |
| Average Net Price | $23,180 | -10.9% | 69th |
| Net Price: $0-30K Income | $18,872 | -3.7% | 74th |
| Net Price: $30K-48K Income | $15,681 | -24.5% | 57th |
| Net Price: $48-75K Income | $21,570 | -8.2% | 73rd |
| Net Price: $75K-110K Income | $21,825 | -6.4% | 56th |
| Net Price: $110K+ Income | $24,946 | +2.1% | 52nd |
| Flag | Section | Status |
|---|---|---|
| Retention Below 80% | Student Outcomes | Triggered |
| Four-Year Graduation Rate Below 50% | Student Outcomes | Cleared |
| Pell Gap Exceeds 10 Points | Student Outcomes | Cleared |
| Revenue-to-Expense Below 1.0 | Financial Health | Cleared |
| Enrollment Declined 5% or More | Financial Health | Cleared |
| Endowment Under $50M or Growth Under 15% | Financial Health | Cleared |
| High Cost, Low Completion | Value for Money | Cleared |
| Spending on Students Below the National Median | Value for Money | Cleared |
| Rising Price, Falling Outcomes | Value for Money | Cleared |